Using DebugView to see debug output in real-time
Download DebugView
DebugView for Windows is available for download from Microsoft’s Sysinternals team.
Emitting debug information from your code
To make your code tell DebugView what it’s doing you use the Debug class in the System.Diagnostics namespace like so:
Debug.WriteLine("[TS] Generating language object for script file");
This will make the following appear in DebugView as the code executes:
Note that the Visual Studio debugger can not be attached, otherwise it’ll grab all debug output to the Output window.
Also, note that the Debug class has multiple methods with multiple overloads to simplify string output.
Start listening to debug output
Start DebugView and make sure to run it as an administrator:
Start DebugView and make sure Capture Events is enabled. It’s available on the Capture menu, or through the tool button: ![]()
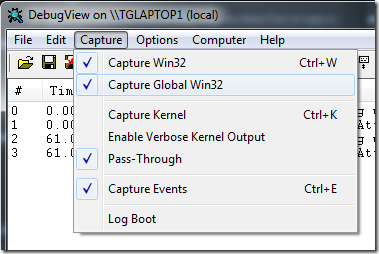
Next, make sure DebugView is set to Capture Global Win32:
Side note: I’m not entirely sure why this is required, but my guess is that dbgview.exe is run in the context of a user (Session ID: 0) and w3wp.exe is run in the context of a service (Session ID: 1).
Filtering and highlighting
Depending on what other processes are emitting debug info, you might want to apply filters and/or highlighting to the list to avoid being overwhelmed. :)
Simply click Filter/Highlight on the Edit menu to apply filters and highlighting.
The filter above would ensure we only include debug messages starting with [TS]:
Keyboard shortcuts
- CTRL + X (clear the list)
- CTRL + T (switch time stamp format)
- CTRL + E (enable/disable capture)
Noteworthy
Here’s the setup on which this post is based:
- Windows 7 64-bit
- IIS7 or Cassini
- IIS7 application pool run as NETWORK SERVICE or a network domain account
Listening to debug output from a remote computer
You can essentially listen to any computer you have TCP/IP access to (note that DebugView has to be running on the target machine). Click Connect on the Computer menu and enter the host name or IP address of the computer you want to listen to. If you want to run DebugView in a minimized, unobtrusive way you can use several different arguments when starting it. Start a command prompt and run dbgview.exe /? to get a list of all available options.


